Democracy and the Benchmark
It seems like we’re entering the YouTube era of benchmarking.

You know how you can go on YouTube and find someone who knows almost nothing about the subject they are posting a video about? Well, benchmarking these days is kind of like that…
Just a quick word about the author. I worked as a senior engineer with Mercury Interactive. Mercury’s LoadRunner tool was/is the industry standard for performance testing/benchmarking. I’ve spent 17 years trying to make people smarter about how they test and tune their systems. I also worked extensively with the ActiveTest group within Mercury, and I’m going to use some of the methods and procedures gleaned over thousands of customers and millions of dollars of R&D to develop the ActiveTest products.
I have to say, I am dismayed at some of the nonsense that I see people posting.
There really isn’t a polite way to say it. Some of these folks don’t even know the basics, so I thought it might make sense to write this post that explains Benchmarking 101. The goal of the post is to hopefully instill the rigor that we’ve seemingly lost and get back to doing intelligent investigation of data and system performance.
Bad Tooling
I will admit that I am biased towards LoadRunner since it is the tool that I know. Any number of tools can generate load in competent hands. For the purposes of this article, I will refer to four components of tooling using ideas from LoadRunner, but you should expand them to whatever tool you use. The four components are:
- a script that hits your test site
- a controller that monitors the test and provides some feedback
- a load injector(s) that scale(s) your script to multiple running users
- some kind of analysis of the output
I’m just going to start with a simple statement. If your test tool is something that you run from a command line, your test results are pretty much worthless. If you run a simple google search, you can find dozens of options that help you produce more reliable results. Tools like Siege, weighttp, etc. tend to be used by very unsophisticated testers because they are free, but generally, more so because they are simple.
weighttp -n 100000 -c [0-1000 step:10 rounds:3] -t 8 -k "http://x.x.x.x:80/index.html"
I’m sorry, but doing an accurate, meaningful benchmarking exercise isn’t a single command line. If you are making any claims beyond some very basic pass/fail stuff, this is useless.
A lot of online tools are available for use, but there are many issues with using them. First and foremost is the lack of control and visibility into conditions. Pingdom and webpagetest.org are good for spot checking performance, but not at all useful for a benchmark. Benchmarking needs to be done in a controlled environment to have any comparative value.
Good Benchmarking Practices
Let’s face it, most of the benchmarks we see published are extremely grandiose in their claims. 13X performance? What does that mean?
Nothing. Nothing at all.
Before you begin, you need to have something you want to test, and a scientifically accurate way to measure it. 13X is a comparative statement. 13X what? How was X measured? Did you measure 13X using the same methodology? Was your test environment under control?
Looking back at the four components, let’s investigate good testing practices.
It all starts with a script. What are you trying to emulate? If you script people browsing catalog pages, does that mean that the checkout process is 13X faster too? How data dependent is your script- are you passing multiple logins and passwords? You aren’t if you run a command line/online tool…
Your controller environment is where you simulate the scenario behavior. Do all of my users arrive at one time (like a holiday sale?) or do they ramp up to help understand where my breaking points are? Are they all doing the same thing, or different things?
How you pair your script and scenario DEFINES what you are testing. This needs to match your goal for the test.
I’ll say that again. Those two components define the condition you are testing. If you see someone publish a benchmark without defining the test conditions or extrapolating it to things not defined in those components, the odds are pretty good that they don’t know anything at all about benchmarking.
And, usually, they prove that they don’t know by the next step…

The load injector has finite capacity. If you see benchmark data that suggests that a load injector seems infinitely scalable, you should probably ignore the results they publish. A simple litmus test is that it takes as much or more hardware to generate load as it does to respond to it. The injector needs to receive all of the data sent by the web server and make sure that the request completes successfully…. And thus, should be on a separate platform from the web server! Good practice is to benchmark your injectors to know exactly how much load they are capable of generating without producing errors.
Lastly, analysis should be automated. In my experience, it is pretty easy to edit away data that suggests problems, so you need to remove that possibility if you are trying to provide a valid benchmark. All of the data should be used, and the data should not contain any error status codes. Vendors all want their products to shine, and that can lead to shenanigans.
So, what are good practices?
Start with a proof statement. Develop a test that exercises only that proof. Validate your test environment. Use automation to collect data and prepare results transparently. Explain anything that falls outside the model.
What is the anatomy of a poorly designed benchmark?
If you use a command line tool, or test without control over the scenario, or test without visibility into a scenario, or drive infinite load with your VM, or use Excel to report…you are practicing bad benchmarking. If you have data that you cannot explain, making something up.
Understanding Data and Relationships
Web performance data is a discipline ruled by mathematics.
There is no politically correct way to say this other than there are a lot of people doing garbage work these days. Aside from the bad testing practices, if you do not understand the data you collect, it is really difficult to explain what happened. It is even worse, if you just start fabricating conclusions. Many of these people are viewed as experts, but they lack a basic understanding of the fundamentals of web performance. It’s time to expose.
Let’s start with the basics. (Understanding relationships)
If I told you that I was going to drive from point A to point B as fast as I could, you would easily be able to calculate how long the trip should take through simple math (distance/speed). A simple mathematical relationship defines time, distance, and speed as a functional relationship. Think of this as an analogy for baseline performance of a single web user.
However, we live in the real world, and we have to share the road. If the road has more lanes, it can handle more cars. If the cars are well coordinated, traffic flows well and our round trip time stays about the same. Think of this as an analogy for a healthy system.
But, what happens when you have more cars than road capacity?
Traffic causes congestion, or a slowing of the round trip time. Even though the road hasn’t changed, its ability to handle traffic deteriorates. Any given road can handle some load of cars. Think of this as an analogy for hits/requests per second. These are measures of performance.
Another physical limitation of a road is the physical size and width of the road. If you consider a Smart car or a VW Beetle vs. a double trailer semi truck, you can see that they will occupy a different footprint on the road. While you might have enough physical space for one of those trucks, it could probably fit 5-6 of the mini cars. Think of this idea as an analogy for throughput. Throughput is a measure of capacity.
We will use these concepts to describe benchmarking and how it models to the road analogy throughout the rest of this post.
Let’s benchmark!
In the following scenario, I have written a simple script that visits a web page. Every time the script finishes, it resets and starts over. Every 10 seconds, a new user joins the scenario, repeating the script in the same manner.
But… remember the first covenant of a benchmark?
What are you trying to show/prove?
For this specific run, I will be illustrating one simple idea: what a healthy load looks like and the metrics that show the mathematical relationships between number of users, hits/sec, connections, and throughput when your test systems are functioning well during a benchmarking exercise…and when you need to stop to investigate.
Using the traffic analogy, I am attempting to figure out how many cars I can add to the road before I start seeing traffic delays… sort of (we will discuss this in further detail later).
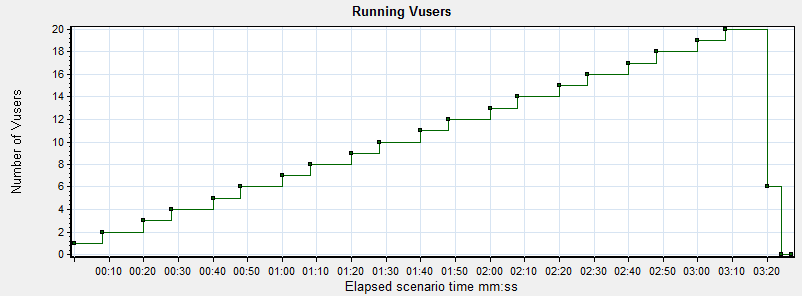
In this graph, you can see that the number of users is scaling slowly. By taking this approach, we can watch the other graphs in the tool and make sure that everything is performing up to expectations.
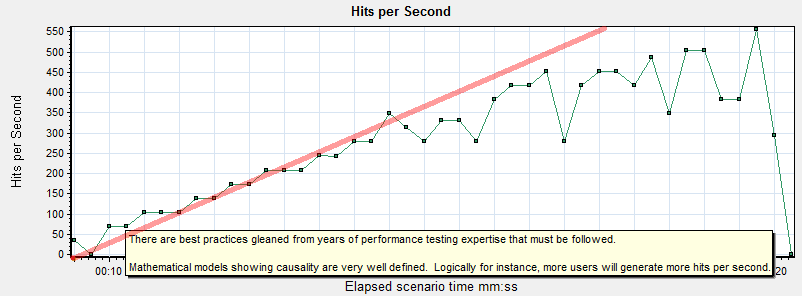
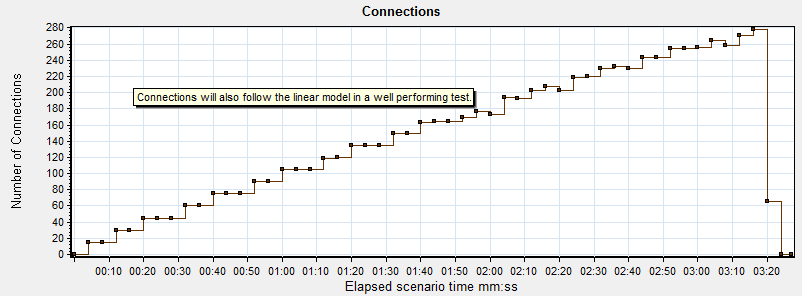
It seems pretty obvious to say that a single user generates a “hit” (or a request for a resource from the web server via a connection), and that two users would generate twice as many, three users three times as many, etc.
There is a mathematical relationship between the number of users running and hits/requests per second. They are linear, meaning that as one scales the other follows it. This relationship holds true from one user to any number of users.
Think of this as the cars on the road. As long as there is no bottleneck in traffic, you can add more cars without impacting commute time. As long as the server isn’t overly busy, it creates the connection and sends the files.
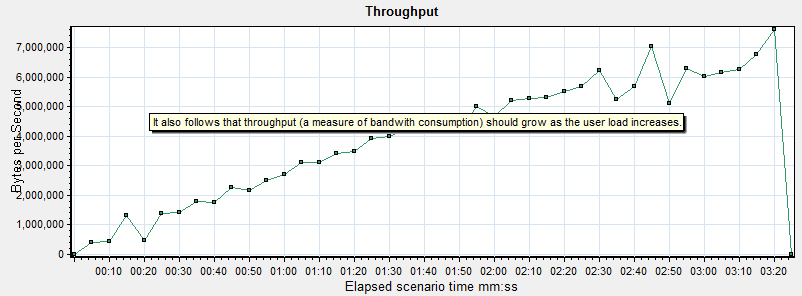

In exactly the same way that users and hits correlate, so will throughput and connection requests in a well behaving benchmark. If you do not see this mathematical relationship between the numbers, stop. Something is broken. Yet another reason that command line/online tools are useless- there is no visibility during the benchmark.
Graphs 1-4 ALWAYS move together linearly in systems that are performing well, independent of scale.


Assuming that all of the mathematically bound graphs are moving well together, you need to validate that there were no errors being returned by the server during the test run. If you look at these graphs, you see nothing but passed transactions and 200 and 302 status codes (a normal redirect, not an error). Any 4XX or 5XX HTTP status codes mean that your web server was not able to handle a request (HTTP Status codes are only returned by a web server).
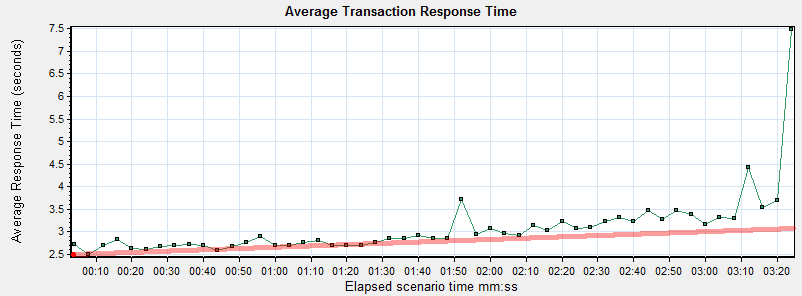
While the run didn’t have a specific performance goal, it is pretty typical to watch transaction performance during a benchmark to get a sense of a few metrics:
1.) What is my no load performance? Here, that occurs around 10s or so into the test and is about 2.7s.
2.) What point does the number of users drive the performance above the threshold of acceptable performance? Let’s pretend that it was 3s and that occurs around 2:30 into the test, which can be referenced back to 16 virtual users running.
3.) What point does the system begin to fail? While this specific test was terminated prior to errors being present, it appears that response times were beginning to grow which indicates there is a problem.
So, I aborted this run… simply because I had the data I needed for this blog post.
Garbage in, Garbage Out
I have a little confession to make. I know what the bottleneck in this test was. I was running the injector on my laptop, which also had the controller… and my e-mail and a bunch of other things open. My laptop began to run out of resources. At the end of the test run, you can see response times jump way up. That is a behavior that occurs consistently with the hard interruption/termination of the tool I use, and has been observed dozens of times.
I thought you said not to use the load injector to monitor?
I did, and for this very reason… however, I know what the limits of my laptop are for this type of work, because I have benchmarked its capability as a load injector. However, in this case, I’m also using it to illustrate what I call an “illogical conclusion”.
What is a garbage conclusion? Frankly, it is nothing more than a lazy guess. In some cases, it is even worse than that: it is a bad guess that goes completely against what the data is saying.
In my example, you might conclude that the web server was slowing down and about to break, because that is what the data looks like it is saying. In reality, the server was perfectly healthy and returning data to the injector as fast as the no load performance. It was the injector that was unable to process it in a timely manner.
If you overdrive your load injector, it will blow up your test results.
Simply put, if you understand the mathematical relationships between the data in healthy systems, you need to stop and investigate what is going on when those relationships no longer work. It’s not rocket science, but it is science.

Simply opening a browser from an independent PC during a benchmark to inspect system behavior can show you if it is your web server or your load injector.
Real world examples of Bad Benchmarking and Illogical Conclusions

First, let me say that I have no other purpose in writing this article except to correct errors out in the community, which is filled with bad benchmarks and misunderstanding. It is a little bit self-serving, though, since I spend a LOT of time defending our products against bad benchmarking/garbage conclusions. Hopefully, this blog post will clear up some of the bad practices and force people to adopt industry standard practices.
Example #1
https://www.rootusers.com/linux-web-server-performance-benchmark-2016-results/
Well, if you read the comments, you’ll see that I try to explain it to him, as I would love to know how we stack up against the competition, but there is so much wrong with everything he’s done that you simply cannot use any of it. I think my last comment has made him pause, as it is reflected by the graphs posted above.
Here’s an easy way to understand why this is Bad Benchmarking and Illogical Conclusions.
If you look at his plot of running virtual users against requests per second, you don’t see the linear relationship as illustrated in my graphs above. 100 users generate the same load as 500 as does 1000?
If that was true, you wouldn’t need to build a bigger server to support a larger user load, since it generates the same number of requests and throughput no matter how many users are running.
Clearly, this test was broken from the start and the results are meaningless, but the tests run on for hours because he is running a command line tool and has no visibility into the fact that his benchmark isn’t doing anything.
It is quite possible that he overworked his load injector similar to my example, because if you refer back to my hits/sec and throughput graphs, you’ll see that they begin to plateau towards the end of the test run. This is a behavior consistent with an overworked load injector. This is nothing more than an educated guess (opinion)- the data is useless (fact).
Example #2
https://www.youtube.com/watch?v=I1_V2u-AUmA&feature=youtu.be
I don’t even know where to begin with this one.

For starters, it is at a national conference where he is being touted as an expert in the subject by the vendor, but I’m going to quickly dispel that myth. This presentation touches on almost every point I’ve mentioned about Bad Benchmarking and Illogical Conclusions, but once again, I’ll limit my analysis to just a couple of key points to prove that this benchmark is worthless.
At about 6 minutes in, the presenter shows us the command line test interface he’s going to use to make his expert analysis.
Siege.
What can you see while running Siege? Nothing. I’ve beaten this topic to death, so refer back throughout if you need to refresh on why a single command line is insufficient for benchmarking. When your test has no UI and things start to break down, you are dead in the water.
At 8 minutes in, the presenter starts discussing results. Remember that linear relationship between the number of users and requests/sec? Do you see it? No. Does that stop him from discussing the results? Not for a second. Instead of trying to figure out what went wrong, he actually tries to explain it!

Every purple graph shows that there was something wrong very early on in the test. Well established linear relationships are not evident in any of them. At 12:45, we can see that performance actually gets better at 100 users than at 50 users! Anomalies like that REQUIRE explanations. It’s like suggesting 50 more cars on the road will make a traffic jam go away!
Let’s focus on the graph at 12:22, because it makes absolutely no sense. If you ignore the broken purple data, and just look at the pink line…at 50 users, it looks like ~20K transactions, but at 100 users it is ~90K transactions? 4.5X the rate for 2X the users? Huh? Where is that transaction load coming from if our baseline data is good? We go to 300 users at 130K transactions? 3X the users and 1.5X the rate? This is a classic plateau being reached, but not when, where, or why the presenter concludes.

When your data is all over the map and doesn’t follow the mathematical model, you better start over. His non-linear scale on the X axis makes his data appear much more linear than it actually is. When replotted, you can clearly see the plateau. It is also much more obvious that his problems start around 100 users, if not before.
When you hit plateaus in benchmarking, it is critical to have some sophisticated error handling in your test scripts. It’s pretty common for a server to be much larger and more capable of handling requests, so you need to make sure that your test environment is not only capable of handling the sending of the request, but the processing of the response as well. Many times, the server will mishandle requests (e.g. send back incomplete pages) or customer error pages rather than 404s (“We’re experiencing issues” error page with a clean HTTP 200 Status OK). I cannot begin to guess what the server was sending back, but I know it wasn’t functioning Magento pages.

I’m fond of this Deming quote, but perhaps it should be amended to say “without data that makes sense, …”
Benchmarking 101 Conclusions
As one of my friends once explained to me, “if you can’t say it simply, you don’t understand it well enough.”
So, here goes my summary:
All data in this type of benchmarking should be straight lines and linear relationships. If you aren’t getting straight lines with a constant slope as user load scales, stop and figure out why. You aren’t doing anything useful if you don’t correct problems.
And never argue against the math and the model…


Comments