Horizontally Auto-scale LiteSpeed Ingress Controller
One of the many cool features about Kubernetes is its ability to scale when load increases. And the LiteSpeed Ingress Controller has several built-in features which helps enable horizonal scaling of itself:
- Prometheus style metrics, which can be exported to Prometheus or Grafana and help you visually or programmatically determine the load level.
- Auto-scaling helm options, which will detect when load is high and automatically scale up and scale back down when load abates.
This blog will walk you though the following processes on your Kubernetes Cluster:
- Installing a simple application.
- Installing the LiteSpeed Ingress Controller with helm options for Prometheus and auto-scaling
- Installing Prometheus
- Installing a load generator to put load to the simple application
- Monitoring the results
This blog assumes little prior experience with Kubernetes, but does expect you to have kubectl and helm installed. You should have access to your cluster available to the console user and familiarity with text editing
Installing a simple application
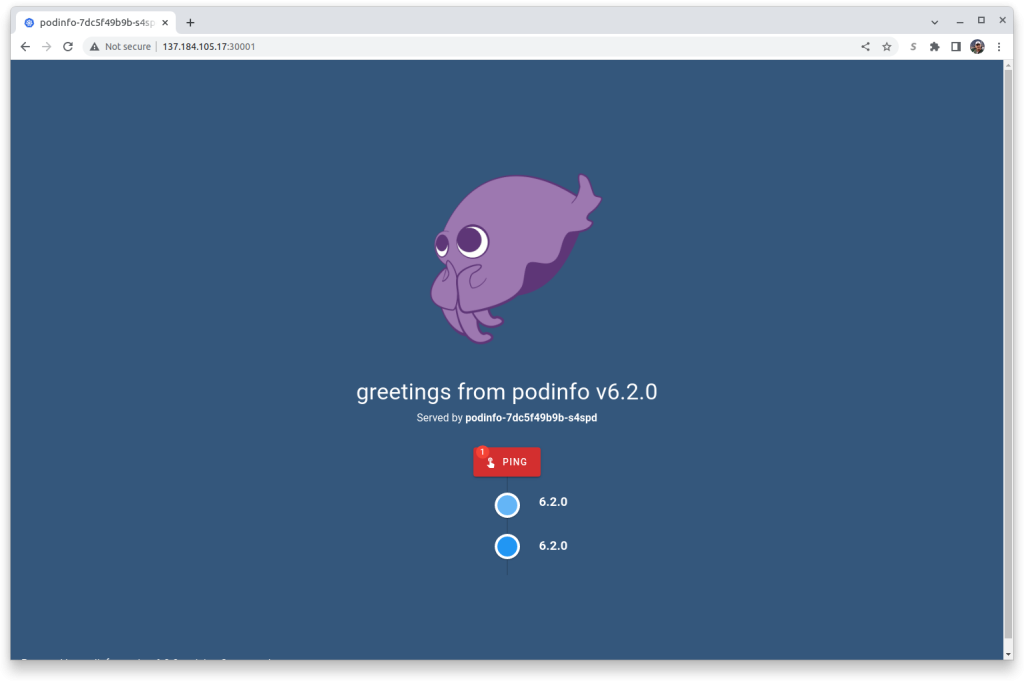
This step uses a small application named PodInfo which simply returns some static text. The text is resolved into a browser image, if run in a browser. However, if run by a load generator, it returns a minimal amount of text.
To install it, use the text editor of your choice and create the file named 1-podinfo.yaml with the following contents:
apiVersion: apps/v1
kind: Deployment
metadata:
  name: podinfo
spec:
  selector:
    matchLabels:
      app: podinfo
  template:
    metadata:
      labels:
        app: podinfo
    spec:
      containers:
      - name: podinfo
        image: stefanprodan/podinfo
        ports:
        - containerPort: 9898
---
apiVersion: v1
kind: Service
metadata:
  name: podinfo
spec:
  ports:
    - port: 80
      targetPort: 9898
      nodePort: 30001
  selector:
    app: podinfo
  type: NodePort
---
apiVersion: networking.k8s.io/v1
kind: Ingress
metadata:
  name: podinfo
spec:
  ingressClassName: lslbd
  rules:
    - host: "example.com"
      http:
        paths:
          - backend:
              service:
                name: podinfo
                port:
                  number: 80
            path: /
            pathType: Prefix
Once saved, apply it with kubectl:
$ kubectl apply -f 1-podinfo.yamlAccessing an exposed application in a Kubernetes cluster
To verify it was installed, find the external IP address of the exposed node it’s running on. In Kubernetes, images are deployed to pods which run on these nodes. To get the node it was run in:
$ kubectl get pods -o=wide|grep podinfoIn my environment, it returned a single line:
podinfo-7dc5f49b9b-s4spd 1/1 Running 0 26h 10.244.2.93 pool-e85y5p9p2-7jkcs <none> <none>
In column 7, it reports the node that it was run in; for me that is pool-e85y5p9p2-7jkcs. Remember that name. Then get the list of external IP addresses for your nodes:
$ kubectl get nodes -o=wideWhich displays on my system:
NAME                   STATUS   ROLES    AGE   VERSION    INTERNAL-IP      EXTERNAL-IP       OS-IMAGE                       KERNEL-VERSION          CONTAINER-RUNTIME
pool-e85y5p9p2-7jkc5   Ready    <none>   5d    v1.21.14   10.136.121.238   159.223.189.158   Debian GNU/Linux 10 (buster)   5.10.0-0.bpo.15-amd64   containerd://1.4.13
pool-e85y5p9p2-7jkck   Ready    <none>   5d    v1.21.14   10.136.121.235   147.182.135.113   Debian GNU/Linux 10 (buster)   5.10.0-0.bpo.15-amd64   containerd://1.4.13
pool-e85y5p9p2-7jkcs   Ready    <none>   5d    v1.21.14   10.136.121.237   137.184.105.17    Debian GNU/Linux 10 (buster)   5.10.0-0.bpo.15-amd64   containerd://1.4.13
And I can see that the pool pool-e85y5p9p2-7jkcs has external IP address of 137.184.105.17. Since the sample exports the application on port 30001 on that IP, you can bring up a browser and enter in the url: http://[YOUR IP ADDRESS]:30001, which for me is: http://137.184.105.17:30001:
Installing the LiteSpeed Ingress Controller
To install the LiteSpeed Ingress Controller you’ll need to follow the basic instructions here. For this excercise you can skip the section Making HTTPS Work. The important change is in Installing the Chart. The helm install line should look like this (assuming that you’re using the namespace ls-k8s-webadc:
$ helm install ls-k8s-webadc ls-k8s-webadc/ls-k8s-webadc -n ls-k8s-webadc --set service.metrics.enabled="true",autoscaling.enabled="true"This is the normal helm install, but also includes the LiteSpeed helm options to enable metrics and autoscaling.
Installing Prometheus
This is an optional step, as it just allows you to see the impact that autoscaling has in your environment. By setting the LiteSpeed Ingress Controller helm option of service.metrics.enabled="true" you are enabling metric exporting from the LiteSpeed Ingress Controller automatically into a Prometheus installed on the cluster. This is generally a low-overhead operation and is quite useful for monitoring LiteSpeed’s operations. To install Prometheus:
$ helm repo add prometheus-community https://prometheus-community.github.io/helm-charts
$ helm install prometheus prometheus-community/prometheus --set server.service.type=NodePort --set server.service.nodePort=30010
Accessing Prometheus in a Kubernetes cluster
To then access Prometheus from a web browser, use the trick above:
$ kubectl get pods -o=wide|grep prometheus-serverIn my environment, it returned a single line:
prometheus-server-57f4946cdb-x54rh 2/2 Running 0 40h 10.244.3.17 pool-e85y5p9p2-7jkc5 <none> <none>
In column 7, it reports the node that it was run in; for me that is pool-e85y5p9p2-7jkc5. Remember that name. Then get the list of external IP addresses for your nodes:
$ kubectl get nodes -o=wideWhich displays on my system:
NAME                   STATUS   ROLES    AGE   VERSION    INTERNAL-IP      EXTERNAL-IP       OS-IMAGE                       KERNEL-VERSION          CONTAINER-RUNTIME
pool-e85y5p9p2-7jkc5   Ready    <none>   5d    v1.21.14   10.136.121.238   159.223.189.158   Debian GNU/Linux 10 (buster)   5.10.0-0.bpo.15-amd64   containerd://1.4.13
pool-e85y5p9p2-7jkck   Ready    <none>   5d    v1.21.14   10.136.121.235   147.182.135.113   Debian GNU/Linux 10 (buster)   5.10.0-0.bpo.15-amd64   containerd://1.4.13
pool-e85y5p9p2-7jkcs   Ready    <none>   5d    v1.21.14   10.136.121.237   137.184.105.17    Debian GNU/Linux 10 (buster)   5.10.0-0.bpo.15-amd64   containerd://1.4.13
And I can see that the pool pool-e85y5p9p2-7jkc5 has external IP address of 159.223.189.158. Since the helm install command line exports the application on port 30010 on that IP, you can bring up a browser and enter in the url: http://[YOUR IP ADDRESS]:30010, which for me is: http://159.223.189.158:30010:
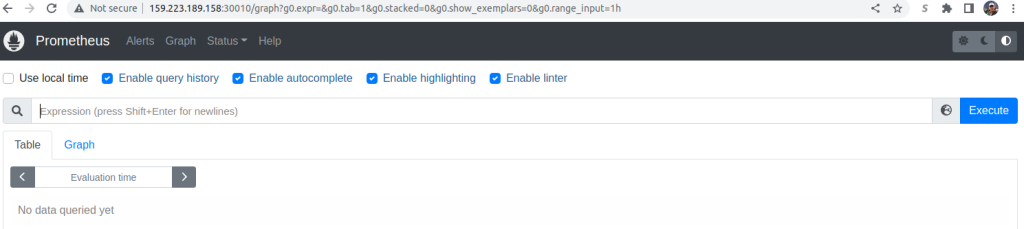
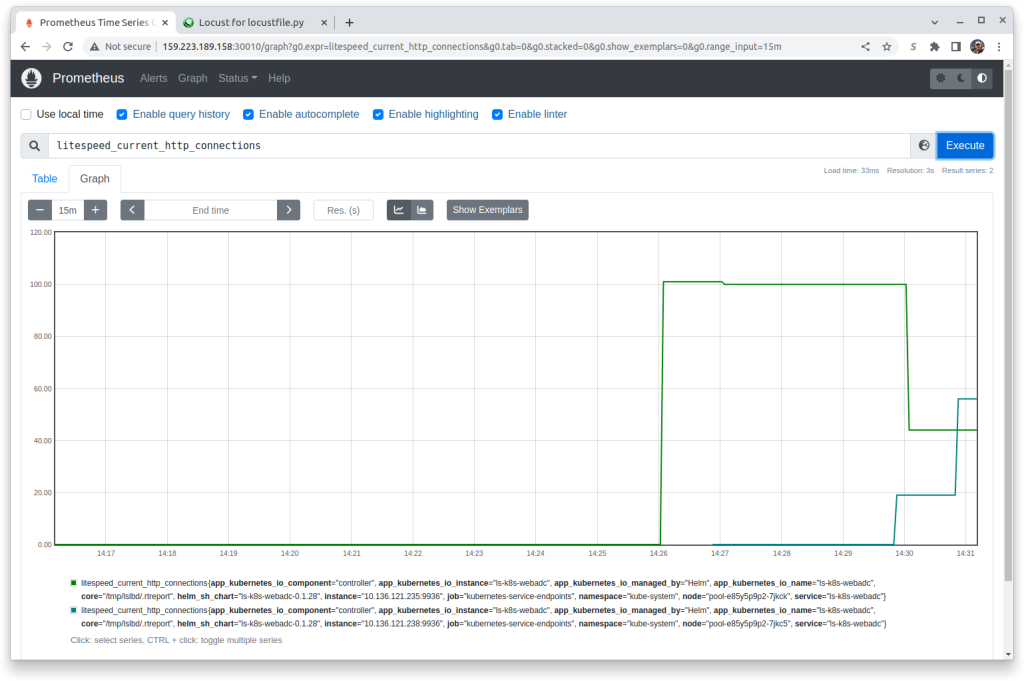
To keep an eye on the LiteSpeed Ingress Controller, enter into the search bar litespeed_current_http_connections, press the Execute button and the Graph tab and you should see any http traffic on your cluster. There may be some random traffic:
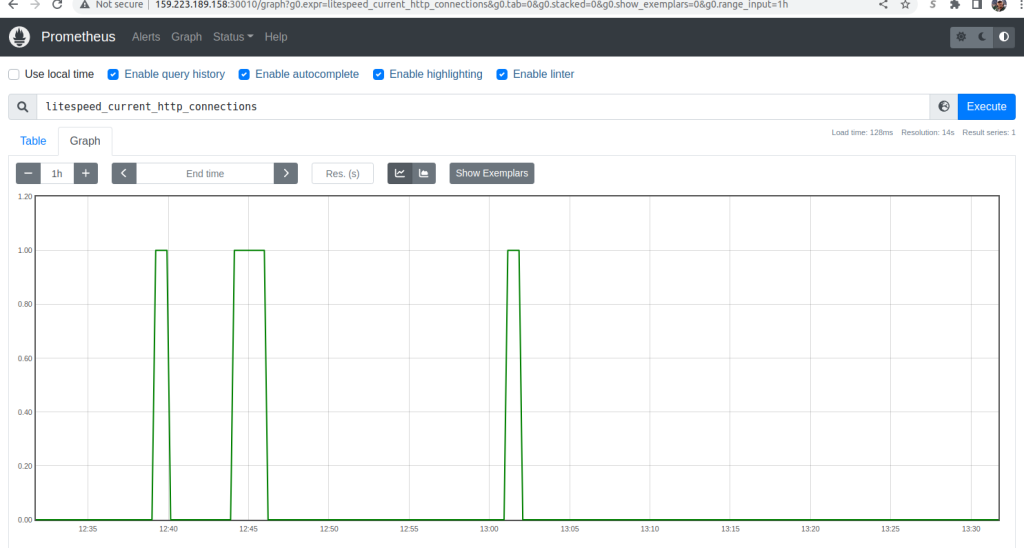
If you do not see a graph, you may need to verify that you used the correct helm parameters when you [installed the LiteSpeed Ingress Controller](#Installing the LiteSpeed Ingress Controller) and check the Troubleshooting documentation.
Installing a load generator
To simulate load, install Locust. Using your text editor create the file 2-locust.yaml using the following contents:
apiVersion: v1
kind: ConfigMap
metadata:
  name: locust-script
data:
  locustfile.py: |-
    from locust import HttpUser, task, between

    class QuickstartUser(HttpUser):
        wait_time = between(0.7, 1.3)

        @task
        def hello_world(self):
            self.client.get("/", headers={"Host": "example.com"})
---
apiVersion: apps/v1
kind: Deployment
metadata:
  name: locust
spec:
  selector:
    matchLabels:
      app: locust
  template:
    metadata:
      labels:
        app: locust
    spec:
      containers:
        - name: locust
          image: locustio/locust
          ports:
            - containerPort: 8089
          volumeMounts:
            - mountPath: /home/locust
              name: locust-script
      volumes:
        - name: locust-script
          configMap:
            name: locust-script
---
apiVersion: v1
kind: Service
metadata:
  name: locust
spec:
  ports:
    - port: 8089
      targetPort: 8089
      nodePort: 30015
  selector:
    app: locust
  type: NodePort
Deploy Locust:
$ kubectl apply -f 2-locust.yaml Accessing Locust
To then access Locust from a web browser, use the trick above:
$ kubectl get pods -o=wide|grep locustIn my environment, it returned a single line:
locust-7885f7b458-hvchm 1/1 Running 0 23h 10.244.3.30 pool-e85y5p9p2-7jkc5 <none> <none>
In column 7, it reports the node that it was run in; for me that is pool-e85y5p9p2-7jkc5. Remember that name. Then get the list of external IP addresses for your nodes:
$ kubectl get nodes -o=wideWhich displays on my system:
NAME                   STATUS   ROLES    AGE   VERSION    INTERNAL-IP      EXTERNAL-IP       OS-IMAGE                       KERNEL-VERSION          CONTAINER-RUNTIME
pool-e85y5p9p2-7jkc5   Ready    <none>   5d    v1.21.14   10.136.121.238   159.223.189.158   Debian GNU/Linux 10 (buster)   5.10.0-0.bpo.15-amd64   containerd://1.4.13
pool-e85y5p9p2-7jkck   Ready    <none>   5d    v1.21.14   10.136.121.235   147.182.135.113   Debian GNU/Linux 10 (buster)   5.10.0-0.bpo.15-amd64   containerd://1.4.13
pool-e85y5p9p2-7jkcs   Ready    <none>   5d    v1.21.14   10.136.121.237   137.184.105.17    Debian GNU/Linux 10 (buster)   5.10.0-0.bpo.15-amd64   containerd://1.4.13
And I can see that the pool pool-e85y5p9p2-7jkc5 has external IP address of 159.223.189.158. Since the yaml exports the application on port 30015 on that IP, you can bring up a browser and enter in the url: http://[YOUR IP ADDRESS]:30015, which for me is: http://159.223.189.158:30015:
LiteSpeed’s IP Address
To be able to put load on LiteSpeed, you’ll need to know its exported IP address. Get the list of all exported services.
$ kubectl get svc -AWhich for me returns:
NAMESPACE        NAME                             TYPE           CLUSTER-IP       EXTERNAL-IP       PORT(S)                      AGE
cert-manager     cert-manager                     ClusterIP      10.245.152.216   <none>            9402/TCP                     323d
cert-manager     cert-manager-webhook             ClusterIP      10.245.60.0      <none>            443/TCP                      323d
default          kubernetes                       ClusterIP      10.245.0.1       <none>            443/TCP                      340d
gateway-system   gateway-api-admission-server     ClusterIP      10.245.91.141    <none>            443/TCP                      43d
kube-system      dashboard-kubernetes-dashboard   ClusterIP      10.245.7.158     <none>            443/TCP                      339d
kube-system      external-dns                     ClusterIP      10.245.107.183   <none>            7979/TCP                     9d
kube-system      kube-dns                         ClusterIP      10.245.0.10      <none>            53/UDP,53/TCP,9153/TCP       340d
kube-system      locust                           NodePort       10.245.43.158    <none>            8089:30015/TCP               3m31s
kube-system      ls-k8s-webadc                    LoadBalancer   10.245.28.197    157.230.201.138   80:31743/TCP,443:30932/TCP   20h
kube-system      metrics-server                   ClusterIP      10.245.83.231    <none>            443/TCP                      41h
kube-system      podinfo                          NodePort       10.245.197.197   <none>            80:30001/TCP                 44h
kube-system      prometheus-alertmanager          ClusterIP      10.245.0.72      <none>            80/TCP                       42h
kube-system      prometheus-kube-state-metrics    ClusterIP      10.245.222.254   <none>            8080/TCP                     42h
kube-system      prometheus-node-exporter         ClusterIP      10.245.200.251   <none>            9100/TCP                     42h
kube-system      prometheus-pushgateway           ClusterIP      10.245.35.25     <none>            9091/TCP                     42h
kube-system      prometheus-server                NodePort       10.245.254.164   <none>            80:30010/TCP                 42h
Look at the NAME column and look for the name ls-k8s-webadc. In that row should be an EXTERNAL-IP address. That will be the address we will be putting load on. In my case it is 157.230.201.138
Simulating Load
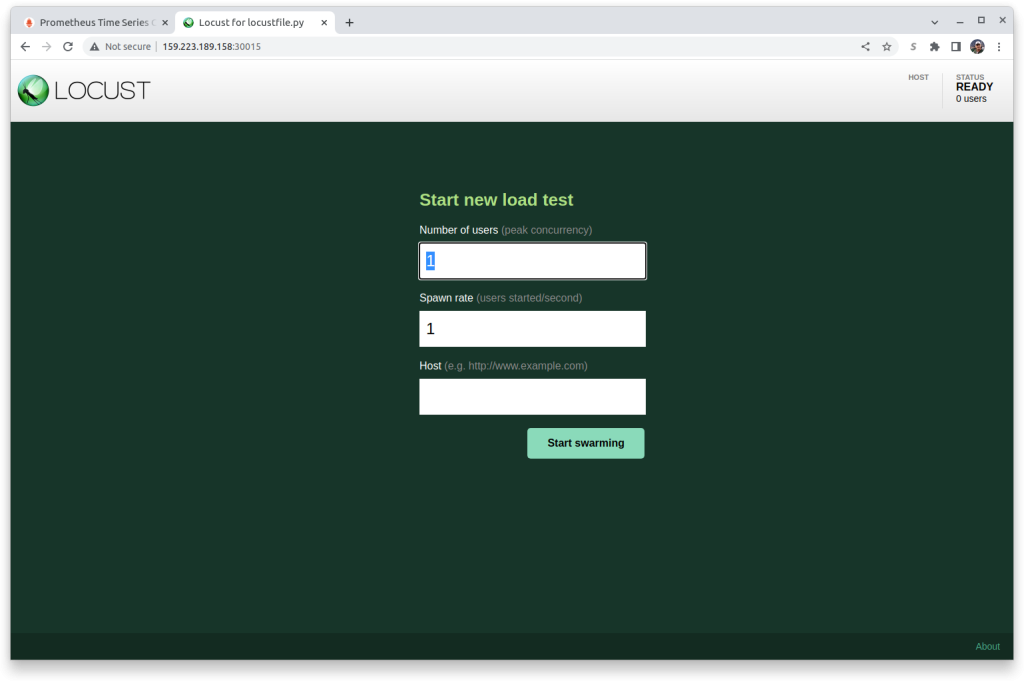
Enter the following values in the Locust Start new load test panel:
- Number of users: 100
- Spawn rate: 10
- Host:
http://[YOUR IP ADDRESS]which for me would behttp://157.230.201.138
to
…and press theStart swarmingbutton.
Monitoring Results
Go back into Prometheus in your browser. You may need to press the Execute button several times and the + or - buttons to adjust the update frequency, and it may take up to 5 minutes for the results to show, but soon you’ll see a single line change into two or more lines.
You can also see the results from the Hotizontal Pod Autoscaler:
$ kubectl describe hpaName: ls-k8s-webadc
Namespace: kube-system
Labels: app.kubernetes.io/component=controller
app.kubernetes.io/instance=ls-k8s-webadc
app.kubernetes.io/managed-by=Helm
app.kubernetes.io/name=ls-k8s-webadc
helm.sh/chart=ls-k8s-webadc-0.1.28
Annotations: meta.helm.sh/release-name: ls-k8s-webadc
meta.helm.sh/release-namespace: kube-system
CreationTimestamp: Thu, 15 Sep 2022 13:31:46 -0400
Reference: Deployment/ls-k8s-webadc
Metrics: ( current / target )
resource cpu on pods (as a percentage of request): 70% (140m) / 50%
Min replicas: 1
Max replicas: 11
Deployment pods: 5 current / 5 desired
Conditions:
Type Status Reason Message
---- ------ ------ -------
AbleToScale True ReadyForNewScale recommended size matches current size
ScalingActive True ValidMetricFound the HPA was able to successfully calculate a replica count from cpu resource utilization (percentage of request)
ScalingLimited False DesiredWithinRange the desired count is within the acceptable range
Events:
Type Reason Age From Message
---- ------ ---- ---- -------
Normal SuccessfulRescale 11m (x2 over 20h) horizontal-pod-autoscaler New size: 2; reason: cpu resource utilization (percentage of request) above target
Normal SuccessfulRescale 7m33s (x2 over 20h) horizontal-pod-autoscaler New size: 3; reason: cpu resource utilization (percentage of request) above target
Normal SuccessfulRescale 7m18s (x2 over 20h) horizontal-pod-autoscaler New size: 4; reason: cpu resource utilization (percentage of request) above target
Normal SuccessfulRescale 2m2s (x2 over 20h) horizontal-pod-autoscaler New size: 5; reason: cpu resource utilization (percentage of request) above target
In my case it wanted to increase the number of pods quite high, but was limited in resources to do so:
$ kubectl get pods -A | grep ls-k8s-webadc-kube-system ls-k8s-webadc-66d78d6755-6nw5w 1/1 Running 0 11m
kube-system ls-k8s-webadc-66d78d6755-j9mmt 0/1 Pending 0 5m29s
kube-system ls-k8s-webadc-66d78d6755-nmfkc 1/1 Running 0 21h
kube-system ls-k8s-webadc-66d78d6755-q8fnj 1/1 Running 0 15m
kube-system ls-k8s-webadc-66d78d6755-xp944 0/1 Pending 0 10m
Note that the status is Pending on a lot of the pods. A detailed description of one of the pending pods will show:
$ kubectl describe pod ls-k8s-webadc-66d78d6755-xp944Name: ls-k8s-webadc-66d78d6755-xp944
Namespace: kube-system
Priority: 0
Node: <none>
Labels: app.kubernetes.io/component=controller
app.kubernetes.io/instance=ls-k8s-webadc
app.kubernetes.io/managed-by=Helm
app.kubernetes.io/name=ls-k8s-webadc
helm.sh/chart=ls-k8s-webadc-0.1.28
pod-template-hash=66d78d6755
Annotations: <none>
Status: Pending
IP:
IPs: <none>
Controlled By: ReplicaSet/ls-k8s-webadc-66d78d6755
Containers:
controller:
Image: docker.io/litespeedtech/ls-k8-staging:latest
Ports: 80/TCP, 443/TCP
Host Ports: 80/TCP, 443/TCP
Args:
/ls-k8s-up.sh
--v=4
--allow-internal-ip=true
--healthz-port=11972
--lslb-debug=false
--lslb-enable-ocsp-stapling=false
--lslb-http-port=80
--lslb-https-port=443
--enable-metrics=true
--metrics-service-port=0
Limits:
cpu: 200m
Requests:
cpu: 200m
Liveness: http-get http://:11972/healthz delay=60s timeout=30s period=30s #success=1 #failure=3
Readiness: http-get http://:11972/healthz delay=60s timeout=30s period=30s #success=1 #failure=3
Environment:
POD_NAME: ls-k8s-webadc-66d78d6755-xp944 (v1:metadata.name)
POD_NAMESPACE: kube-system (v1:metadata.namespace)
Mounts:
/var/run/secrets/kubernetes.io/serviceaccount from kube-api-access-nwspm (ro)
Conditions:
Type Status
PodScheduled False
Volumes:
kube-api-access-nwspm:
Type: Projected (a volume that contains injected data from multiple sources)
TokenExpirationSeconds: 3607
ConfigMapName: kube-root-ca.crt
ConfigMapOptional: <nil>
DownwardAPI: true
QoS Class: Burstable
Node-Selectors: <none>
Tolerations: node.kubernetes.io/not-ready:NoExecute op=Exists for 300s
node.kubernetes.io/unreachable:NoExecute op=Exists for 300s
Events:
Type Reason Age From Message
---- ------ ---- ---- -------
Normal NotTriggerScaleUp 2m6s (x11 over 12m) cluster-autoscaler pod didn't trigger scale-up:
Warning FailedScheduling 55s (x14 over 13m) default-scheduler 0/3 nodes are available: 3 node(s) didn't have free ports for the requested pod ports.
The warning message at the bottom basically said that it was unable to scale the pod because there was not a free node to schedule it on. If there was, Prometheus would show additional lines. This is normal and expected.
Removing Load
When you remove load, the number of pods should be reduced. In the Locust browser screen press the Stop button. In Prometheus you’ll be able to see the load decrease. However, the number of pods will not go down for a while. To smooth the impact of scaling down, there is typically 5 minutes of reduced load per pod before it begins to scale down. This may mean up to 25 minutes before the number of pods is back to 1. You can watch the process with:
$ kubectl describe hpaName: ls-k8s-webadc
Namespace: kube-system
Labels: app.kubernetes.io/component=controller
app.kubernetes.io/instance=ls-k8s-webadc
app.kubernetes.io/managed-by=Helm
app.kubernetes.io/name=ls-k8s-webadc
helm.sh/chart=ls-k8s-webadc-0.1.28
Annotations: meta.helm.sh/release-name: ls-k8s-webadc
meta.helm.sh/release-namespace: kube-system
CreationTimestamp: Thu, 15 Sep 2022 13:31:46 -0400
Reference: Deployment/ls-k8s-webadc
Metrics: ( current / target )
resource cpu on pods (as a percentage of request): 4% (8m) / 50%
Min replicas: 1
Max replicas: 11
Deployment pods: 1 current / 1 desired
Conditions:
Type Status Reason Message
---- ------ ------ -------
AbleToScale True ReadyForNewScale recommended size matches current size
ScalingActive True ValidMetricFound the HPA was able to successfully calculate a replica count from cpu resource utilization (percentage of request)
ScalingLimited False DesiredWithinRange the desired count is within the acceptable range
Events:
Type Reason Age From Message
---- ------ ---- ---- -------
Normal SuccessfulRescale 29m (x2 over 20h) horizontal-pod-autoscaler New size: 2; reason: cpu resource utilization (percentage of request) above target
Normal SuccessfulRescale 25m (x2 over 20h) horizontal-pod-autoscaler New size: 3; reason: cpu resource utilization (percentage of request) above target
Normal SuccessfulRescale 24m (x2 over 20h) horizontal-pod-autoscaler New size: 4; reason: cpu resource utilization (percentage of request) above target
Normal SuccessfulRescale 19m (x2 over 20h) horizontal-pod-autoscaler New size: 5; reason: cpu resource utilization (percentage of request) above target
Normal SuccessfulRescale 2m59s (x2 over 20h) horizontal-pod-autoscaler New size: 1; reason: All metrics below target
Cleaning Up
You will want to remove the exposed services and pods, perhaps keeping Prometheus and the LiteSpeed Ingress Controller.
To remove locust
$ kubectl delete -f 2-locust.yamlTo remove the simple application:
$ kubectl delete -f 1-podinfo.yamlIf you wish to remove Prometheus:
$ helm delete prometheusIf you wish to remove the LiteSpeed Ingress Controller:
$ helm delete ls-k8s-webadcFullfilling the Promise
LiteSpeed’s WebADC Load Balancer already has a number of tools to scale to meet demand including:
- Smart Botnet Detection
- WordPress Protection from WordPress brute force attacks
- Server-level reCAPTCHA
- Multiple load balancing techniques
- …and more…
Taking advantage of the Kubernetes AutoScaler combined with its independent, stateless mode of operation allows your organization to expose the full value of all of the services that you’ve worked so hard to build.
Comments